The cattle were divided into 2 groups – the probiotic group and controlled group for the trial.
The cattle were fed an average of 1kg – maize, soy, sunflower and silage. They were allowed to free graze after they had eaten.
In the trial, there was a 16% – 21% increase in growth for the probiotic group.
This trial was done over 90 days.
groups
0
Days
0
growth
+0%
SDA Trial Results - 1
This data shows that there was a marked improvement of cattle that weighed under 400Kgs during the start of the trial. The cattle picked up an average of 88,2 kgs in the probiotic group while the controlled group picked up an average of 34,2 Kgs during the 90 day period.
This data shows growth rates of cattle that initially weighed 200Kg in the probiotic group. They were given 1 kg of feed per day, with 27g of probiotic and allowed to free graze afterwards.
200 Kg group Probiotic
Tag
Starting Weight
End Weight
% Weight Gain on original mass
Weight GAIN
Daily Weight Gain
Outlier
Daily Growth
Average Feed Given
FCR
KMM BORIS
249,9
400
60%
150,1
1,67
No
1,7
1,027
162%
KMM
200
416
108%
216
2,40
No
2,4
1,027
234%
KMM05
293
480
64%
187
2,08
No
2,1
1,027
202%
TM02
270
345
28%
75
0,83
No
0,8
1,027
81%
KMM08
251
418
67%
167
1,86
No
1,9
1,027
181%
KKM06
240
320
33%
80
0,89
No
0,9
1,027
87%
KMM
209
461
121%
252
2,80
No
2,8
1,027
273%
TM13
298
312
5%
14
0,16
No
0,2
1,027
15%
KMM02
257
380
48%
123
1,37
No
1,4
1,027
133%
TM08
264
418
58%
154
1,71
No
1,7
1,027
167%
NO
234
268
15%
34
0,38
No
0,4
1,027
37%
Averages
251,44
383,45
55%
132,00
1,46
1,46
1,027
143%
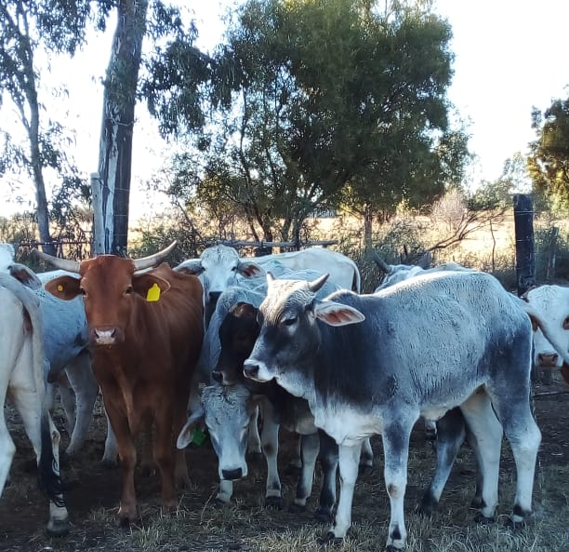
Before Trial
These are the cattle before the trial, this was when foot and mouth prevented transport of livestock and the conditioning of the cattle was worsened due to a drought and insufficient feedstock in the area.
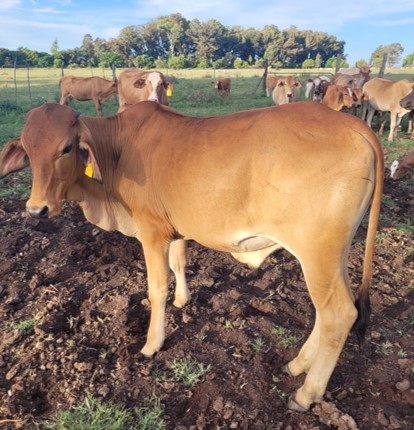
After Trial
These are the cattle after the trial, they were given 1kg of feedstock with the probiotic every day.
This was after a 3-month periods of being given feed and being allowed to free graze on the farm.